Figure C7h.2 Model of intervention effects gained by a project evaluation
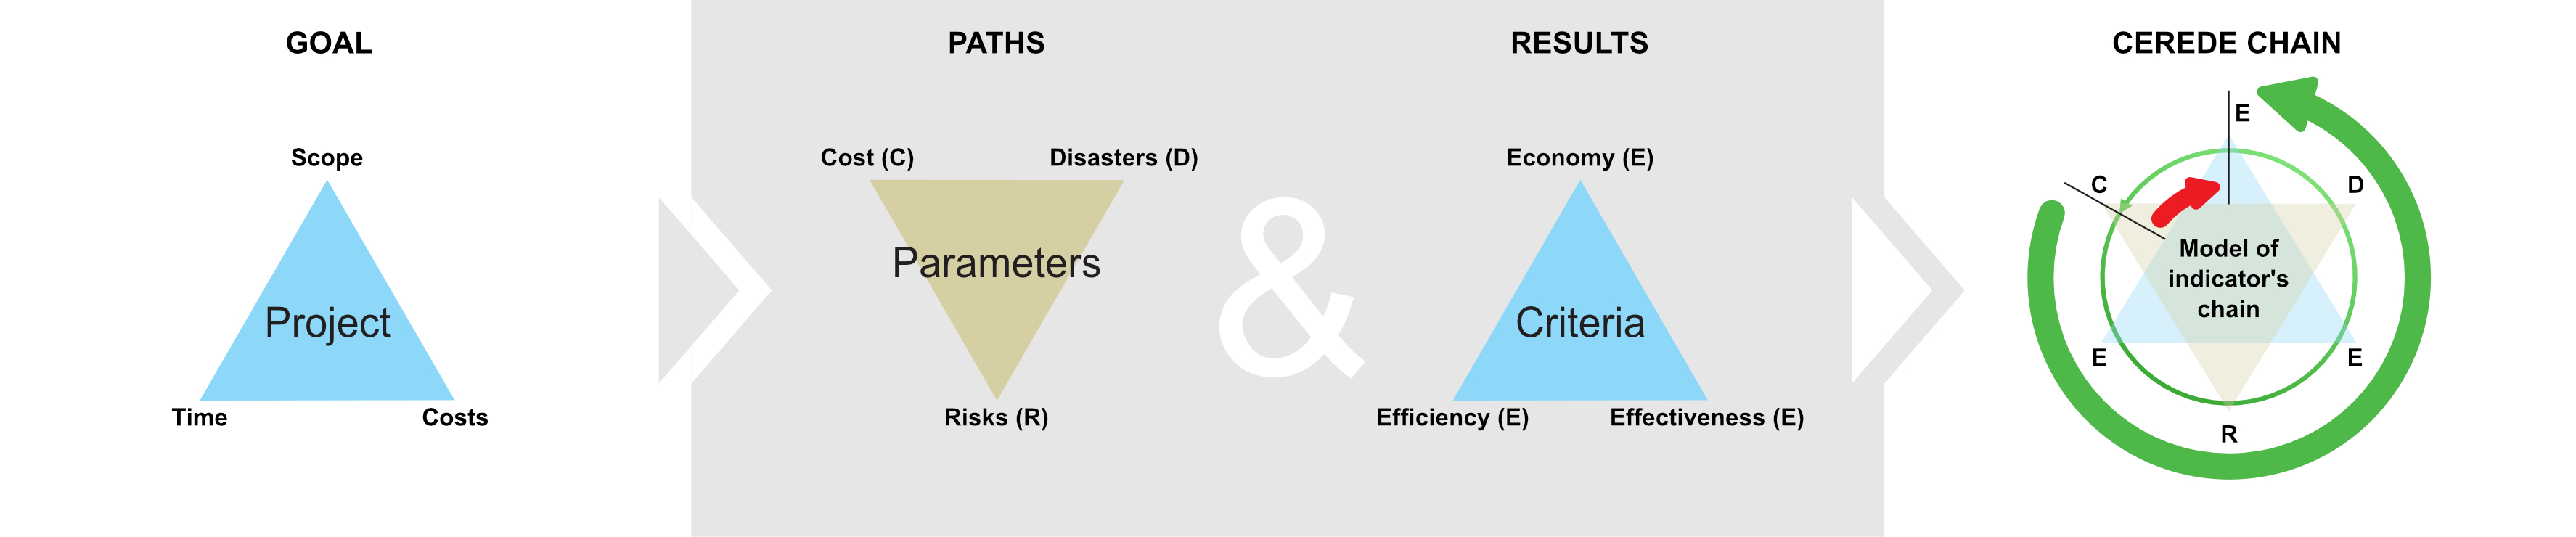
Figure C7h.2 Model of intervention effects gained by a project evaluation
Diagram C7h.2 says: that a fast connection between the sustainability and relevance of the wellbeing and safety stage in the life cycle of an object is dangerous. The longer way is pragmatic and safer. When considering sustainability, it is essential to consider its impacts if it should be efficient. Suppose you can achieve maximum productivity with minimum wasted effort or expense. Then it would be best if you weighed the share of the degree to which your action can be successful in producing the desired result. It is about effectiveness. After that, you can identify the quality of how you can form unified steps in this way (algorithms). Coherence helps you to grasp the relevance of your sustainability.
Figure C7h.2 also follows the diagram technique from the previous chapters. Says: relying on the link between relevance and sustainability criteria (everything will turn out well and be sustainable with the project) would be a naive approach (a short path is not enough, and a blind person who thus submitted).
It would help if you went a long way. If we want sustainability from a project, we need to know its impacts and completed form. Make sure that the resources consumed (money, material, people, etc.) are sufficient (efficiency) and sufficiently serve to achieve the goal of the project (effectiveness).
We still have to monitor whether the project meets the objectives (expectations) and whether the work on the project is systematic and logically connected. The project forms one meaningful whole (consistency). Following Figure C7h.3 offers a standard view of the role of indicators and criteria in projects.
It describes the possible path from the fundamental indicators (scope, time, and costs) through the parameters and the evaluation principle to determine the actual results chain. It is more than finding the basic principles of scaling processes in projects. The goal is to get data when scaling the project process (e.g., to understand project stages).
We know that the project is a data package of the present time (As-Is) and has to generate the data which content validation we expect when the project is completed or operated (To-Be).
To propose project parameters (e.g., costs limits, impacts of a catastrophe, or risks scale evaluation) and criteria we would like to monitor (e.g., economy, efficiency, and effectiveness) is a difficult task.
We can simplify it using a Dialectical Diagram (DD) to have a more general and profound comprehensive view (e.g., on a project portfolio reflecting selected drivers of a specific province's needs).
We can derive a simple chain of tasks (functions) and obtain a chain of evaluations and, finally, results of any monitored stages and relevant details through DD.