Figure C3g. The path with navigation to the goal (to the To-Be milestone)
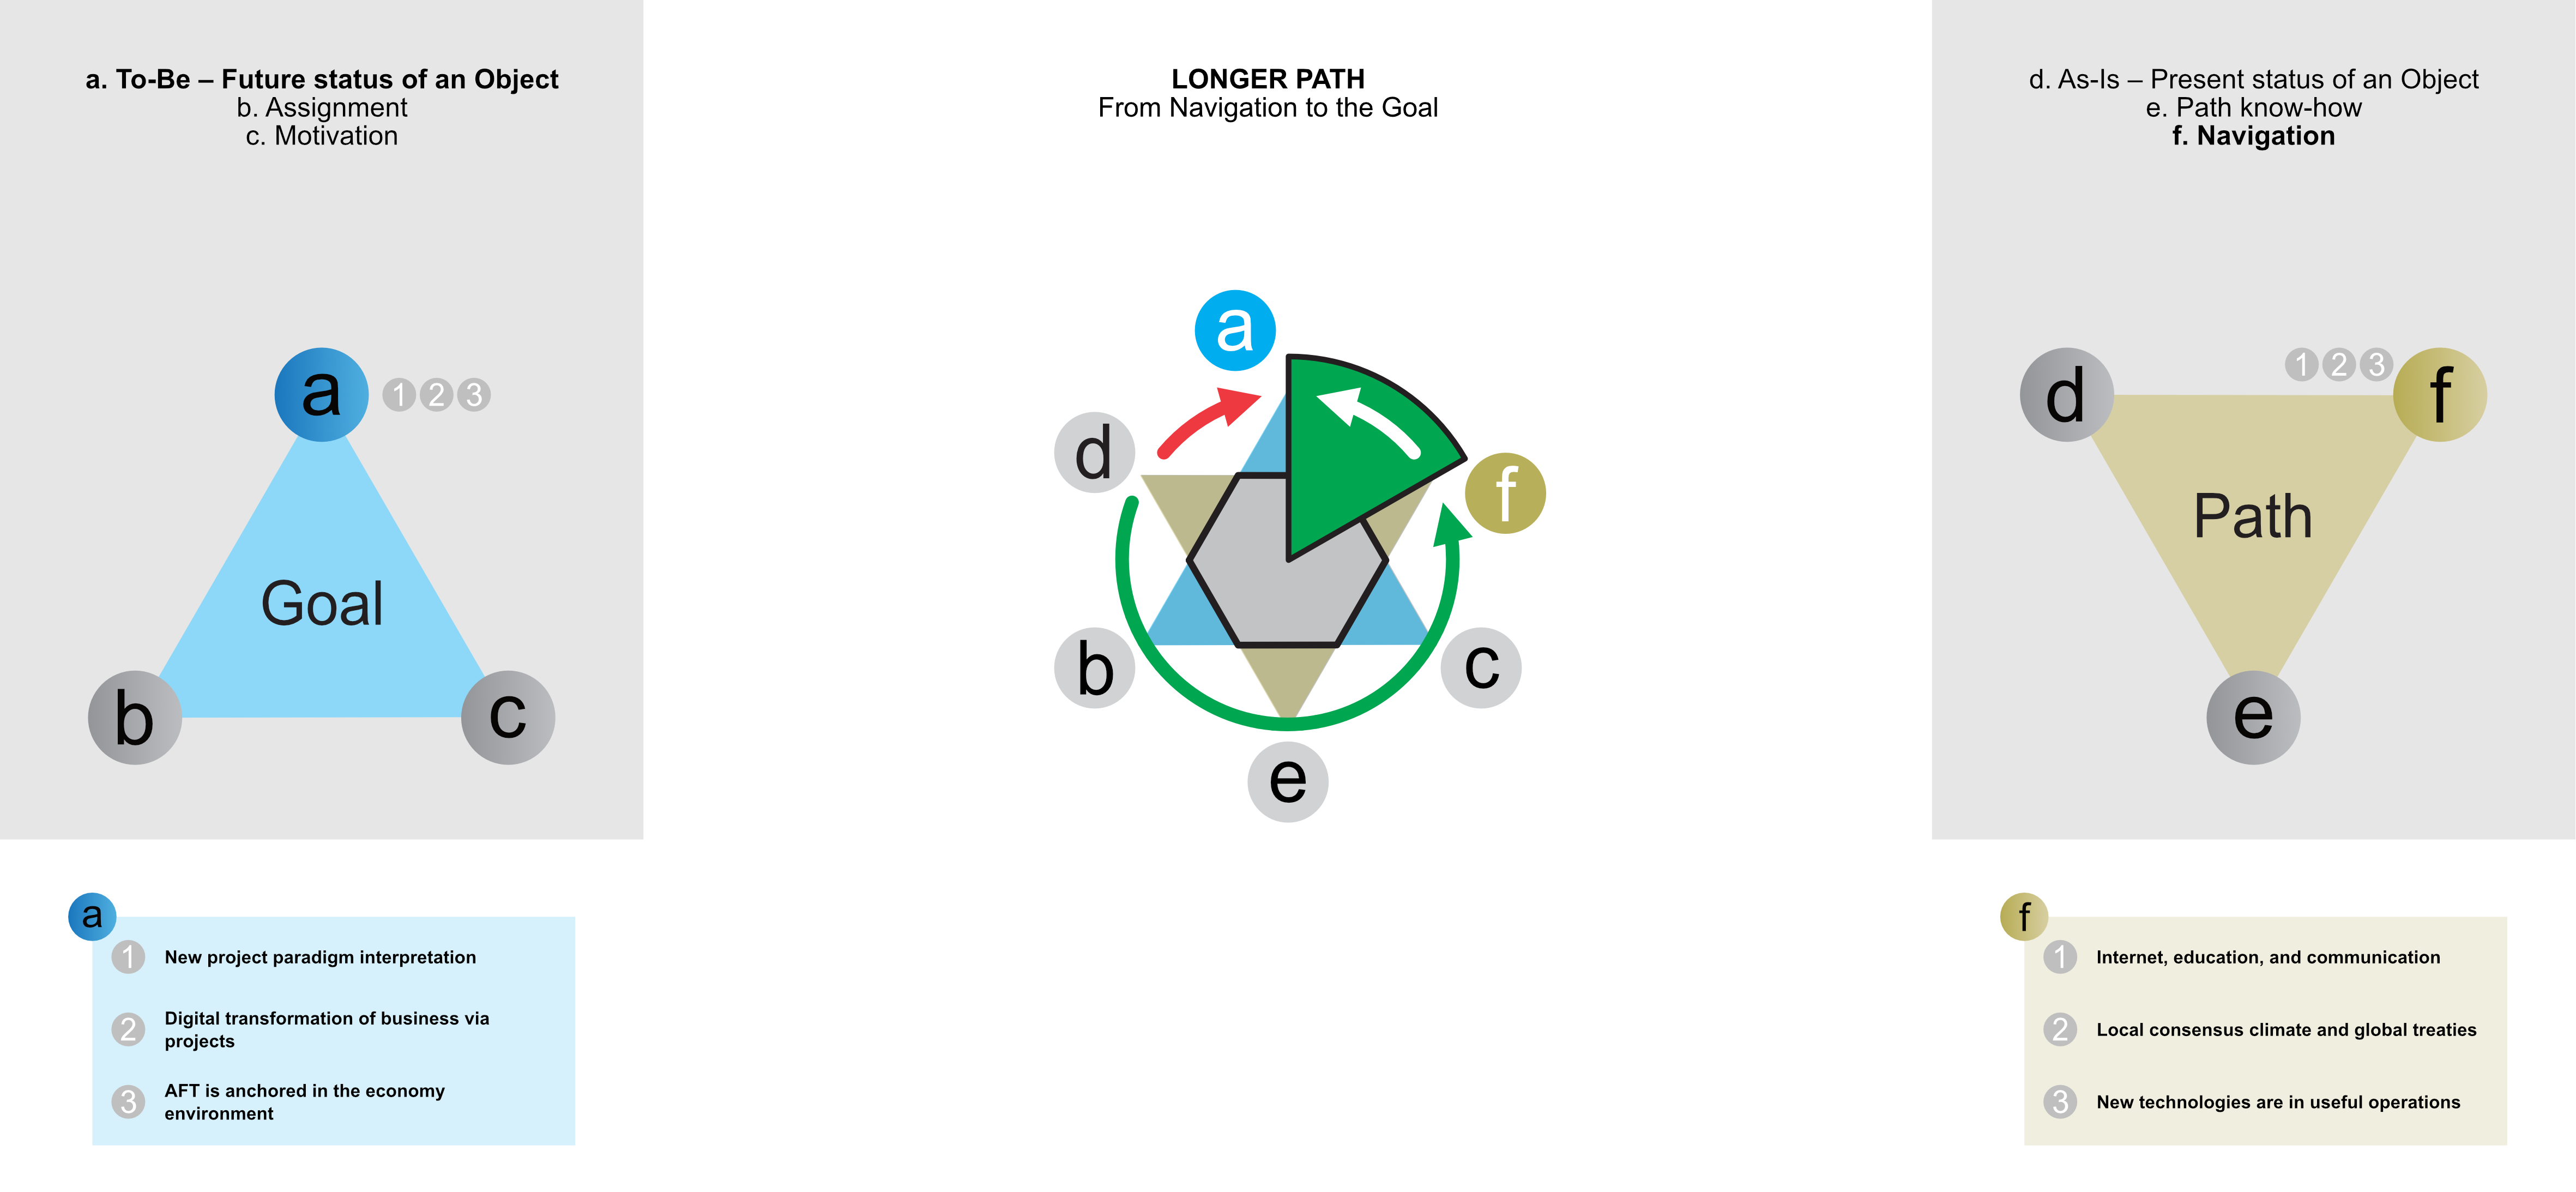
Figure C3g. The path with navigation to the goal (to the To-Be milestone)
The example ends and suggests using the previous steps for targeted navigation of a huge task to achieve "To-Be" status in a longer but feasible way. In terms of grades (steps, actions), this again represents a hierarchy of three strings for two states:
Internet, education, and communication - new project paradigm interpretation,
Local consensus climate and global treaties - Digital transformation of business via projects,
New technologies are in functional operations - AFT is entering the economic environment.
It summarizes the partial ways to achieve results in a large international project.
But that's not all. Imagine that you describe a task using DD under the default assumption, for example, that 1 + 1 = 2. It will establish a true argument for your model. Innovators will certainly come to you with assumptions, for example, that 1x + 2y = 2 or that 1x + 2y = 3 and more.
They will assure you that x, y can be changeable or constantly be equal to one, but at the same time, they will raise doubts, how is it with the assumption, where is proper in such fuzzy thinking? You must react: isn't it too early to consider synergy? And to say to yourself: Is it time to go into details?
In such a situation, you have two options. You will either put your head in order or immediately kick such an innovator out of your team. Otherwise, it will be a waste of time in open discussions, and the volume of generated unknowns will grow over your head.
But you want to complete the task. Therefore, defend the truth of your assumption, complete the job, debug your model, and present the result.
Only then can you return to the innovator's view of what he wanted from you. If you defend your assumption 1 + 1 = 2, for example, in the way that the water always flows from top to bottom, then your truth is that the stump in the forest always remains a stump, and the ox will always be an ox wins.
Then your model will also recognize your surroundings and defend the result of your work. Eventually, the model you built and debugged will become an added value for the following steps to solve the task after applying DD.
All four charts and a short case story reflect and verify the versatility of a proposal of graphic assistance. Dialectical Diagrams (DDs) are flexible tools.
They are helpful to react to any stage of project needs; identification, preparation, implementation, and evaluation (use) of results that the project can bring to a society of action people living in a specific locality.
At the same time, they can use their native languages and discuss (negotiate) things in sufficient depth. Of course, all participants must know the leading language (an integrator) in advance; this webbook works in English.