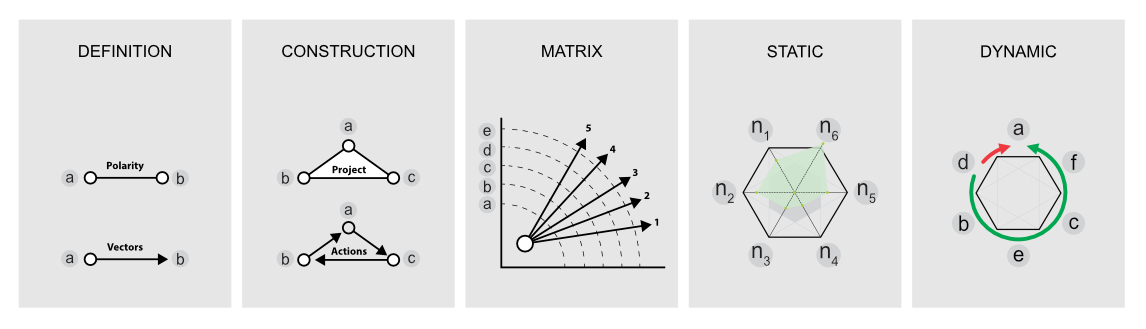
Figure C2b. Examples of philosophy and mathematics in projects processes models
Model
A project model is a clear and visual description of a project. Project models can look very different regarding the detail and scope of an actual project.
Some models can reflect a specific industry, area of the project, or even a specific task. A model can come in many shapes, sizes, and styles. It is important to emphasize that a model is not the real world but merely a human construct to help us better understand real-world systems.
All models generally have an information input, an information processor, and an output of expected results. Any model is a source of data in specific relationships that the model defines. Data of a model don't have a general (statistical) value. Their value is the data structure and testing this structure in the model environment.
Polarity
Polarity is a unique feature of two opposing elements in a particular environment (for a living or inanimate object). Both parts have a mutual relationship (e.g., Earth: North and South Poles, Nature: rain and drought, or Humans: men and women).
We distinguish the polarity of contradiction (contrasts), the polarity of logic (cause and consequence), the polarity of the complement (book and reader), the polarity of quality and quantity (for evaluation functions), and, e.g., the polarity of negation – negation (for control functions). Polarity forms dual models and captures the relationships between two of its elements.
Triad
The world is entering the digital age and breaking down traditional language barriers. So, the meta-language (the language of logic symbols) has got a new chance. Shared understanding and common approach depend on precise translations and the main topics for discussion.
Logical signs (e.g., triad, double triad) support penetration into strategy detail, protect debates against demagogues; maintain the necessary degree of clarity (transparency), and offer assurance about the discussion's credibility.
The triad is built based on the harmony of three attributes (elements). There are two manners of how to gain a triad.
The first looks simple if a triad exists as a logical unit and is widely accepted (e.g., project triad: project scope, costs, and time).
The second means a triad construction (e.g., via two polarities, see Figure C4c.1).
Vector
Vectors describe anything with both a direction and a magnitude. Vector has an arrow and a line segment, the length of which represents the vector's magnitude.
Figure C2b shows two ways for triad understanding: a matured triad (learned by practice or consensus on discussion) based on solid knots and vectors that reflect an actual situation. Vector navigates relations between knots; its arrow indicates its direction, position, and a line its magnitude.
Matrix
Matrix is the environment or context in which an idea, a scope of a project, or a system changes and grows. A matrix is an arrangement of numbers, symbols, or letters in rows and columns, which assists in solving mathematical problems in any development or safety apps.
The simple method according to Google “5 Vectors Model at a Glance” represents the U.S. Navy model.
This model is about how to select a career level (e.g., Master), how to select a development area (e.g., Leadership), and then click on the node at vectors intersection to find the career development elements.
An idea of application of this model for the SPC Concept is demonstrated by two examples on Figures C5b, c.
Static Model
A static model describes the system's fixed structure and defines the classes (groups of tasks) in a system, the attributes of the functions, the relationships between processes, and the operations of each action.
The static model doesn't contain any internal history of previously applied input values (an example of a static model is a set of algebraic equations).
Graphs are operating for visual presentation. There are many graphs (columnar, pie, bubble, etc.). An example of a ray (radar) chart presents in this Figure.
Dynamic Model
Dynamic Modeling describes those aspects of the system concerned with the time and sequencing of the operations.
It is helpful to specify and implement the control aspect of the system. It is also beneficial for state modeling (a state model describes the states and events using a diagram or table).
There are many different state diagrams and tables (e.g., G. Causal Loop Diagrams are helpful for System Models, or Flow Charts consist of nodes and lines showing how an algorithm or process works).
The Figure presents an example of a hexagon case (for computers, it is open for n-gons solutions).
In an object-oriented approach, a state model is typically used to describe the lifecycle of a complex object. Tables effectively express states and events and can be generated automatically from knowledge gained from a state diagram.
Tables and graphs are often combined to control processes or generate output control flow from input control flows.
Dialectical Diagram (DD) complements and extends the search for consensus through expert (interest) discussion on goal setting and finding ways to reach the goal.
The Hexagon symbolizes the universality and the meaning of a distributed system in a specific environment (Hexagon is a shape – a symbol, mark – that best fills a plane with equal units, leaves no wasted space, and minimizes the perimeter for a given area).
In this sense, the DD demonstrates the harmony of 6 attributes (elements), which have standard links on a polarity principle. It results in a demonstration of two triads that form one Hexagon.
We need simple, universal, and transparent rules to scale and digitalize the super package SED, DRR, and HA projects; we need regulations to understand, know, and control what we are doing, why, and how to build supposed progress and benefits.
The DD offers to operate six attributes (items, milestones) with standard links on a polarity principle through two triads in one Hexagon. One of two triads indicates the goal; the second shows the path to the destination.
Hexagon offers two tracks to one goal and leads us in reading a short (red) and longer (green) way to the goal. All are on one diagram. Individual attributes (items) indicate a protocol chain of a process in preparation.
We have two options (compare Figure C2c and C2d). Figure C2c presents two triads and introduces attributes (protocols) of a chain. It is a static description of logic protocols respecting the triad structure.