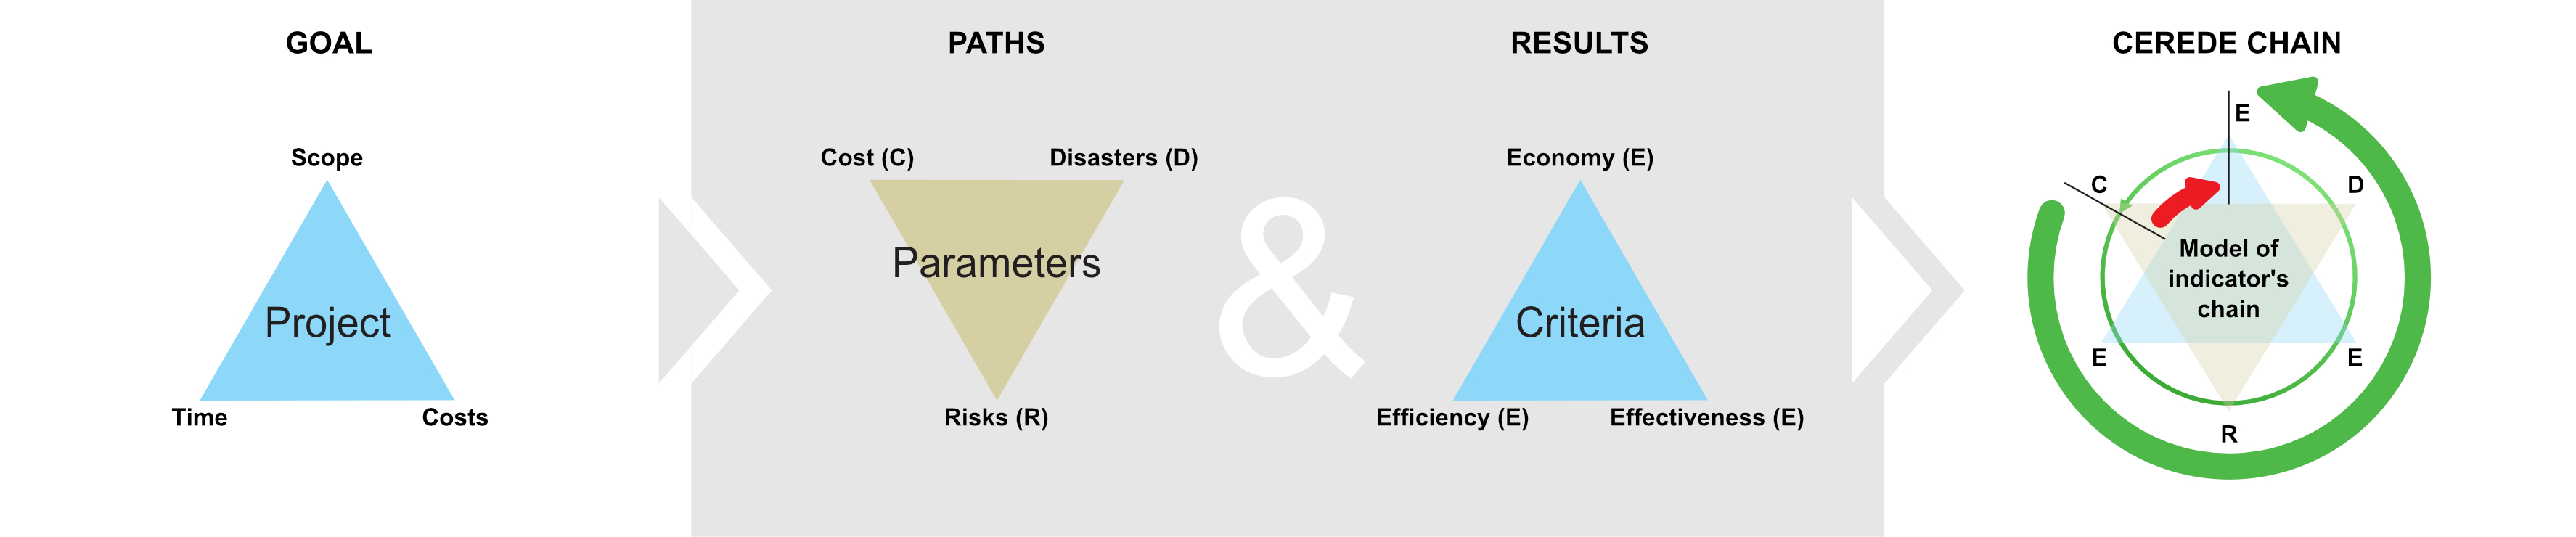
Figure C7h.3 Indicators, criteria, parameters, and CEREDE chain
Indicators
It is about measurable states that assess whether or not associated criteria are being met (for simple comparison this: one behavior = indicator).
Parameters
A parameter is a certain quantity or set of things (e.g., costs, disasters, or risks) that characterize the state, phenomenon, or process that we monitor (e.g., limits of costs, impacts or scaling of catastrophe, or risk management feasibility). For example, compare this: one action in a project = one parameter).
Criteria
It is a principle or standard by which something may be judged or decided (e.g., a project economy, efficiency, and effectiveness).
Assessment
Evaluation is a systematic process of documenting and using empirical data on the preparation and implementation of projects, acquired knowledge, skills, attitudes, abilities, and beliefs to improve projects in various, usually national or regional programs. Evaluation is a systematic basis for concluding the results of projects. It is the process of defining, selecting, designing, gathering, analyzing, interpreting, and using the information to enhance its development.
Grading
Evaluation is the process of applying standardized measurements for different levels of results in many areas (e.g., in the macroeconomic evaluation of individual territorial units, to evaluate their financial strength and liquidity, etc.). Ratings (grades) can be assigned as letters, ranges, percentages, or numbers from a possible total. Depending on the purpose, rates can be averaged. According to Wiki, these academic assessments have a set structure. It originated in the United States and is commonly used as five, six, or seven letters. Traditionally, the grades are A+, A, A−, B+, B, B−, C+, C, C−, D+, D, D−, and F, with A+ being the highest and F the lowest. In some cases, marks can also be numerical. Generally, A – is the highest grade you can get for an assignment.
Evaluation
The evaluation aims to determine the meaning, value, or status usually in the program and its projects or portfolios. The evaluation is backward from the project manager to the owner of the work obtained by the project. The main types of evaluation are process, impact, output, and summative evaluations in the ax-ante, interim, and ex-post phases.
Results chain
A results chain is a logical model that identifies the links from a project's inputs through all its milestones and related work packages to its completion and commissioning. Assessment and evaluation are used for this purpose. At the same time, it identifies external factors that influence or affect the final result (e.g., relevant grading systems).
Project parameters, their indicators, and criteria for evaluating and comparing results (e.g., for project benchmarking) help project teams to determine their work positions, prerequisites for fulfilling project phases, setting relevant goals, and for their control, step by step. It enables and improves estimates of intended outcomes and impacts.
Following Figure C7h.3 offers a standard view of the role of indicators and criteria in projects. It describes the possible path from the fundamental indicators (scope, time, and costs) through the parameters and the evaluation principle to determine the actual results chain.
It is more than finding the basic principles of scaling processes in projects. The goal is to get data when scaling the project process (e.g., project stages).
We know that the project is a data package of the present time (As-Is) and has to generate the data we expect when the project is completed or operated (To-Be). To propose project parameters (e.g., costs limits, impacts of a catastrophe, or risks scale evaluation) and criteria we would like to monitor (e.g., economy, efficiency, and effectiveness) is a difficult task.
It allows us to derive a simple chain of tasks (functions) and obtain a chain of evaluations and, finally, a view of results of any monitored stages and relevant details through the Dialectic Diagram (DD).
The results chain can say that assessing the project's economic (financial) result according to the required costs (charges, fees) is wrong for project costs calculation. The direct relationship between project costs (money consumption) and its outcome (value obtained) is misleading.
Not being overloaded with a massive portion of mostly incorrect input data for a detailed Feasibility Study (FS) and finally don't know how to utilize gained (output data) in a running time and changeable environment of each project is a welcome opportunity.
Unfortunately, one of many reasons is that it is still an attractive game. "Having money in your pocket is better" rather than the need to "have money in accounts" under strict internal financial control for the future, e.g., securities.
Therefore, a short trip, according to DD, is not recommended. A project's internal financial control (IFC) needs data born on a long journey.
These are data on the project's meaningful use (efficiency), data on the risks associated with the project's preparation and implementation, and constant verification of the data obtained (e.g., whether financial resources are spent correctly and by the project tasks as a whole). But even that is not enough.
A new situation will arise if the project is affected by a disaster in its preparation or implementation. It can bring new demands (e.g., the project's financial status must stay accountable; in other words, what is to be spent must also be countable to what has already been paid).
Only in such an economic environment is it possible (feasible) to prove the project and confirm the credibility of the data in its life cycle. Internally (e.g., via rigorous internal financial control and internal audit) and externally (e.g., any external audit assisted by the benchmarking studies).